Overview
Extensively validated to ensure positive lipid identification
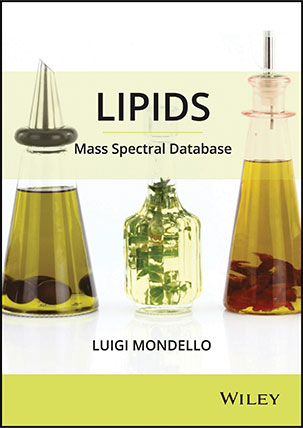
The Lipids Mass Spectral Database contains 430 GC mass spectra registered from a pure standard and categorized into 11 classes of lipids. The database provides significant support for peak assignment in complex mixtures, making it a valuable tool in many research areas such as food analysis and clinical and medical applications.
Over 1,400 Linear Retention Index (LRI) values for the 430 lipid-like molecules, experimentally calculated for each standard under repeatable chromatographic conditions and using three different stationary phases, namely SLB-5ms, Equity-1, and Supelcowax-10 (Supelco). LRI were also calculated using different reference mixtures, namely alkanes, fatty acid methyl esters (FAMEs), and fatty acid ethyl esters (FAEEs). Additional component information such as CAS number, common name, systematic name, nominal mass (as Mol Wt.), compound formula, chemical class, and suppliers of the standards are also included.
Library Specifications
Spectra: 430
Structures: 430
Unique Compounds: 428
LRI Values: > 1,400
Classes of lipids: 11
Compound Coverage
Compound coverage can be searched at www.compoundsearch.com. The number of compounds in each class is listed below:
- Alkanes: 34
- Fatty acid ethyl esters: 27
- Fatty acid methyl esters: 199
- Fatty acid trimethyl esters: 14
- Fatty alcohols: 24
- Fatty aldehydes: 48
- Isoprenoids: 2
- Quinones and hydroquinones: 3
- Sterol trimethylsilyl esters: 12
- Sterols: 3
- Wax monoesters: 64
Ordering Information
|
Product Code |
Product |
Format |
| 9781119289388 |
Lipids Mass Spectral Database |
DVD |
| 978EALDB05789 |
Lipids Mass Spectral Database |
Digital Download |
